
| Table 32. Yield summary of the dryland regional cotton variety test the at AG-CARES Farm, Lamesa, 2000. | |||||||
| Designation | 1995 | 1997 | 1998 | 1999 | 2000 | Average | Comp. Average* |
| Five Year Average | |||||||
| All-Tex Atlas | 442 | 435 | 137 | 265 | 37 | 263 | |
| All-Tex Excess | 510 | 493 | 131 | 342 | 59 | 307 | |
| Paymaster Tejas | 518 | 422 | 201 | 263 | 59 | 293 | |
| Seedco 9023 | 420 | 406 | 204 | 270 | 41 | 268 | |
| Tamcot Sphinx | 592 | 500 | 142 | 334 | 43 | 322 | |
| Three Year Average | |||||||
| Paymaster 1220 BG/RR | 112 | 251 | 53 | 139 | 261 | ||
| Paymaster 2200 RR | 134 | 289 | 53 | 159 | 281 | ||
| Paymaster 2326 BG/RR | 138 | 276 | 88 | 167 | 289 | ||
| Paymaster 2326 RR | 183 | 329 | 73 | 195 | 317 | ||
| *Patterson, R.E. 1950. A method of adjustment for calculating comparable yields in variety tests. Agron. J. 42:509-511. | |||||||
-
AgriLife Today
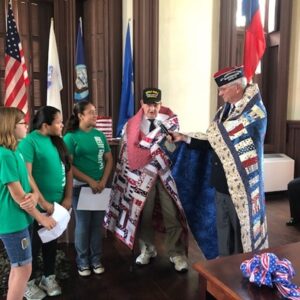
- Texas 4-H wraps current, former military members in Quilts of ValorApr 24
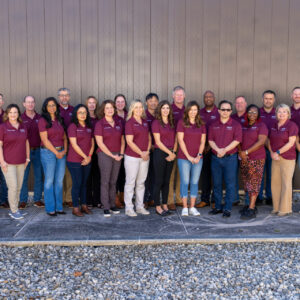
- LEAD AgriLife cohorts set to shape future of organizationApr 24
- Engineering environmental excellence in the next generationApr 24

- An Aggie’s perfect fit, and giving back Apr 24

- Texas 4-H volunteers assist the next generationApr 24

- Texas 4-H wraps current, former military members in Quilts of Valor