
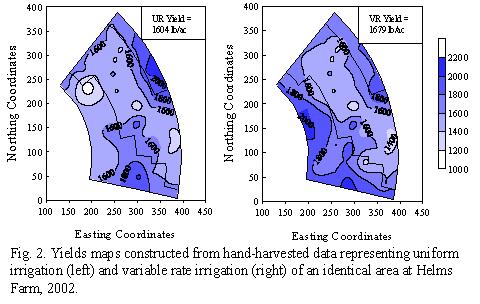
Fig. 2. Yields maps constructed from hand-harvested data representing uniform irrigation (left) and variable rate irrigation (right) of an identical area at Helms Farm, 2002.
Variable Rate Irrigation of Cotton with LEPA
Fig. 2. Yields maps constructed from hand-harvested data representing uniform irrigation (left) and variable rate irrigation (right) of an identical area at Helms Farm, 2002.